Below is a 9-step guide on how to create a Sentiment Analysis using Word Cloud in SAS Visual Analytics:
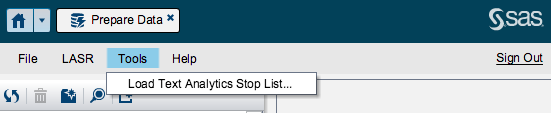
1. Load the Stop List (see note below) using the Data Preparation App from the VA Hub. (This is Create Data Query App in the older version of VA.)
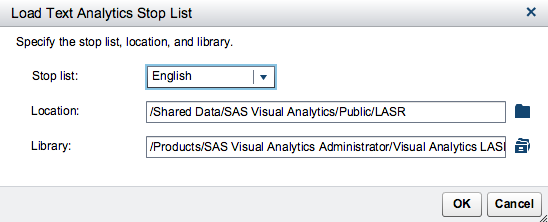
2. Enter correct 'Location': /Shared Data/SAS Visual Analytics/Public/LASR and 'Library'.
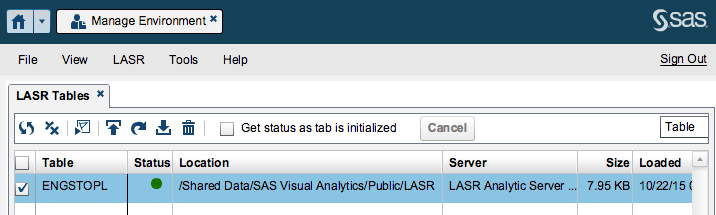
3. ENGSTOPL is the Stop List table name and it should be running after it has been loaded.
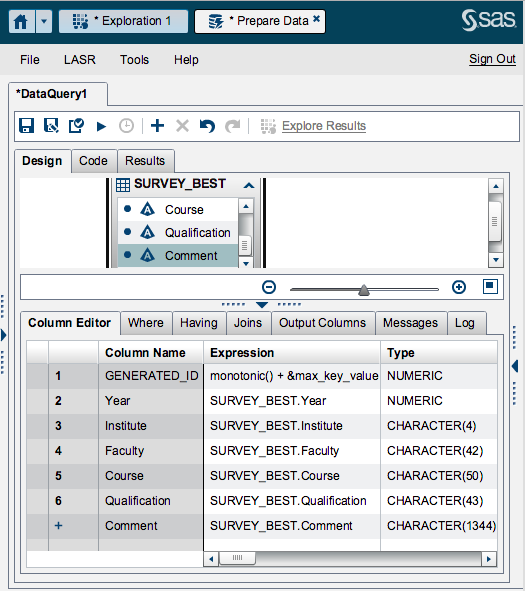
4. Create New Query for the table to be used in the Word Cloud. Right-click on the first row and click 'Add Generated Key Column'.
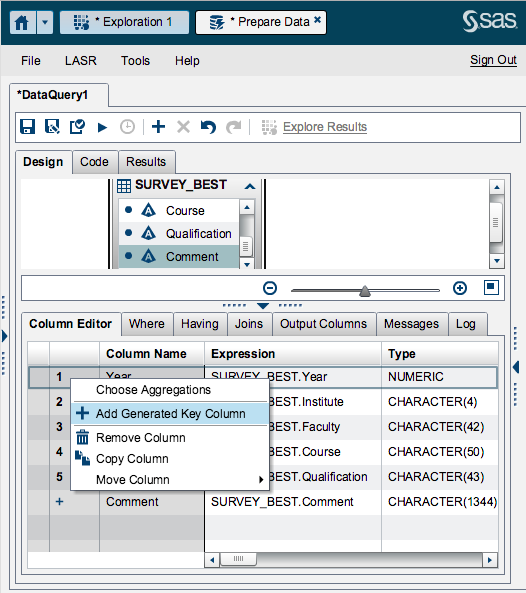
5. The 'GENERATED_ID' is a unique key which is numbered from 1 to total number of rows. This can also be done using Excel (Fill Series).
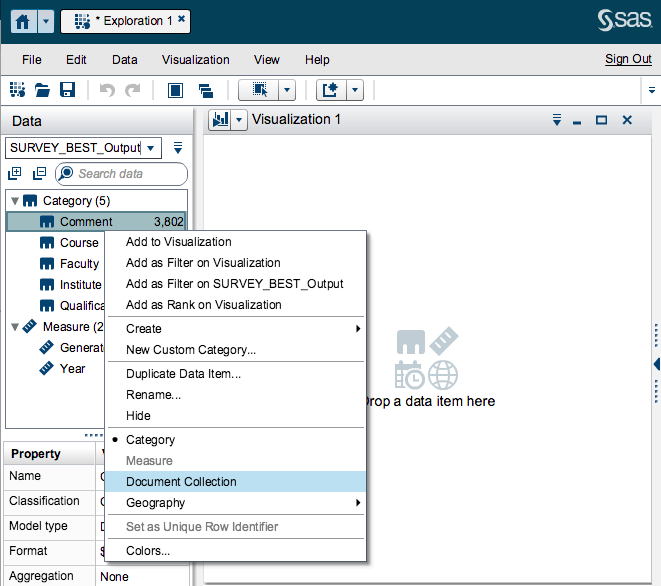
6. Using the Data Explorer App, select the output of the above query as the data source. Right-click on the appropriate column (Comment) and select 'Document Collection'.
7. The 'Unique Identifier column' is the inserted column in Step 4 which is 'Generated Key'.

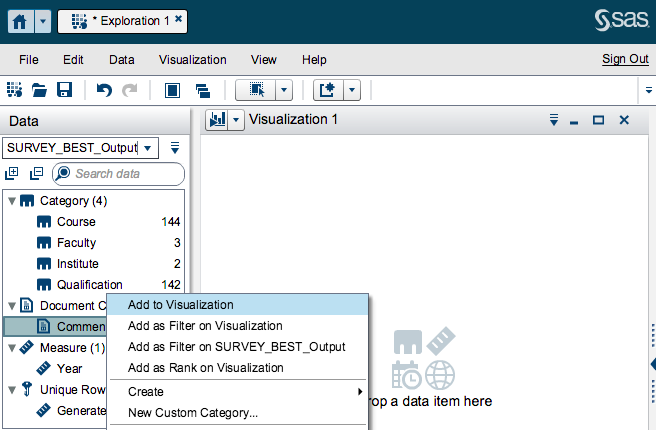
8. Right-click on the Document Collection column (Comment) and select 'Add to Visualization'. (The visualization chart type should automatically change to Word Cloud. If not, manually change it.)
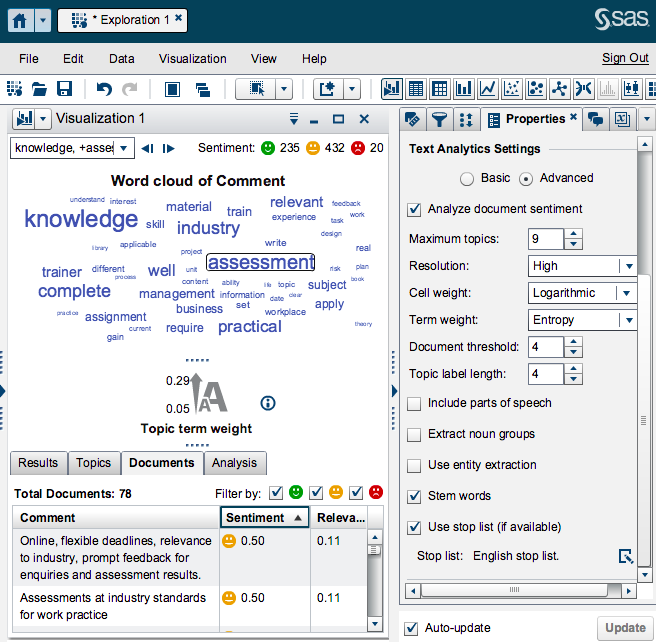
9. On the Properties tab, click on the 'Advanced' button and the 'Analyze document sentiment' check box. Change other parameters as required. Clicking on any word (eg assessment) will show all comments and the respective sentiments related to this word.
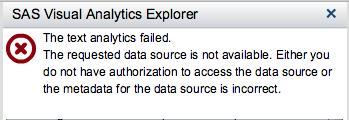
* Note: When a Stop List isn't loaded yet, the following error will be flagged because the data source ENGSTOPL cannot be found:
It took me a couple of days to figure out on how text analytics works, reading through a lot of blogs and documents. I am sure any one can do it in a different approach.
I just want to share my way and hope this guide will be helpful to some SAS VA fanatics.
Comments
0 comments
Article is closed for comments.